


Research on temperature characteristics and compensation Algorithm of high precision Marine pressure sensor
Pressure sensors are widely used in ocean observation systems such as tsunami monitoring, water level gauge, tide gauge, thermohaline depth sounding instrument, buoy, submersible marker, underwater mobile platform and seabed observation network. With the development of ocean observation technology, the measurement accuracy of pressure sensor is more and more demanding. Piezoresistive pressure sensor as a widely used pressure sensor, has the advantages of fast response, small size, high precision, high sensitivity and no moving parts Ⅲ, but because of the semiconductor material and manufacturing process, the temperature characteristics of this type of pressure sensor is poor, the measurement value is easily affected by the environmental temperature, the need for temperature compensation when using.
The Laboratory of Marine Measurement Sensor Technology of National Oceanographic Technology Center undertook the research task of "863" project "high precision pressure sensor for Marine purpose", and developed the high precision pressure sensor with temperature together with Shenyang Sensor Technology Institute. Sapphire is selected as the core base material of the sensor, and the same crystal structure of sapphire as monocrystal silicon in some crystal direction is used to generate monocrystal silicon by low-pressure gas phase epitaxy method. The silicon strain resistance is made to form Wheston bridge. At the same time, a 100n platinum resistance with a resistance change rate of 0.39n is sputtered inside the sensor. To get the temperature signal at the same time. After the high precision A/D circuit collects the voltage signal of temperature and pressure in real time, the software algorithm in the single chip microcomputer makes real-time temperature compensation and dynamic correction to the pressure sensor, and finally gets the high precision digital pressure output.
1. Experimental scheme of sensor temperature characteristics
Put the pressure sensor and acquisition circuit in the high and low temperature test box, and set the temperature control point as 50, 43, 35, 25, 15, 5, 0, -5℃. After the temperature balance, use the high precision piston manometer (accuracy: 0.005%F.S) were calibrated at 0, 1, 3, 5, 10, 15, 25, 35, 45, 55, 60M Pa, respectively. The experimental results are shown in Table 1.
2. Analysis of temperature characteristics
In order to facilitate the analysis of the temperature characteristics of the sensor, the experimental data are drawn as Figure 1. It can be intuitively seen that under different pressure conditions, the pressure voltage of the sensor has a linear relationship with the resistance value of the platinum resistance. At low pressure, the temperature coefficient is positive. As the pressure increases, the temperature coefficient gradually becomes negative.
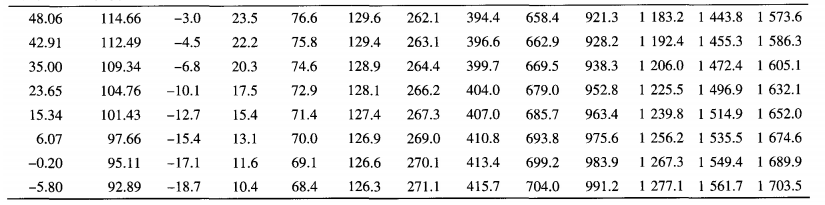
Table 1 Output voltage data of pressure sensor under different temperature and pressure conditions (mV)
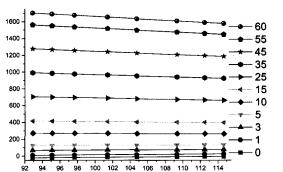
Figure 1 Output voltage data of pressure sensor under different temperature and pressure conditions
By linear fitting the pressure and voltage of the sensor to the temperature, the slope (i.e., temperature coefficient) obtained was plotted according to the pressure curve (FIG. 2). It can be seen that the temperature coefficient also presents a good linear relationship with the pressure.
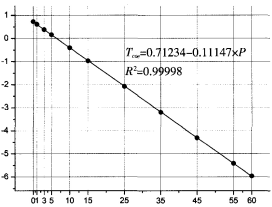
Figure 2. Relationship between temperature coefficient and pressure of pressure sensor
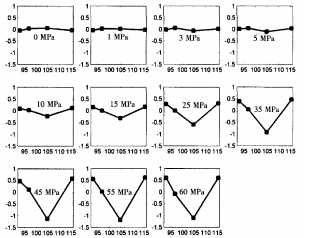
The residual difference after linear fitting of the pressure and voltage of the sensor and the temperature was plotted according to the temperature curve (Figure 3). It can be seen that the fitting error was approximately parabolic and related to pressure. It is shown that the temperature coefficient of the sensor is affected by the coexistence of pressure and temperature.
3. Pressure sensor temperature compensation algorithm
The basic idea of the temperature compensation algorithm is to correct the pressure and voltage at a specific temperature to the pressure output at the corresponding room temperature (23.65 ℃ in this experiment, corresponding to the platinum resistance value of 104.76n), and then calculate the pressure value using the pressure calibration coefficient at room temperature.
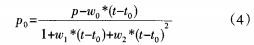
Based on the above analysis of the temperature characteristics of the pressure sensor, it is not difficult to conclude that the measured value of pressure and voltage (p) under a certain temperature (r) of the pressure sensor and the pressure and voltage under the corresponding room temperature (r0) environment (p. It can be expressed in the following relation:

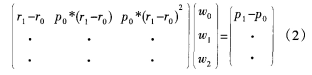
Where: r is platinum resistance value; r0 is the platinum resistance value at room temperature; W0 and W1 represent the temperature coefficient of the sensor under different pressures; Is a nonlinear correction term for temperature coefficient related to pressure. The temperature compensation coefficients W0, W1 and W2 describe the temperature characteristics of the pressure sensor under different pressures, which can be regarded as constant to a certain extent.
The optimal values of W0, W1 and W2 can be obtained by using the pressure calibration data under various temperature conditions and solving the following equations with the help of linsolve function of MATLAB.

When measuring the pressure sensor, the single chip computer first reads the platinum resistance value and pressure voltage value, and calculates the pressure voltage at the corresponding room temperature:
Then, the pressure value after temperature compensation is converted into equation (3).
4 Temperature compensation results
The above method is used to obtain the temperature compensation coefficient of the pressure sensor and calculate the output voltage after compensation (see Table 2). After temperature compensation, the pressure and voltage are basically not affected by temperature.
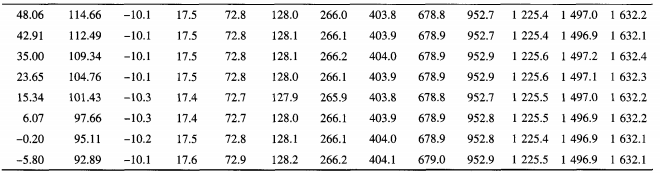
Table 2 Output voltage data of pressure sensor under different temperature and pressure conditions after temperature compensation (mV)
Surrogate pressure coefficient ao, a1, a2, a3, calculate the pressure value, subtract the standard pressure of piston type manometer to get the measurement error as shown in Figure 4:
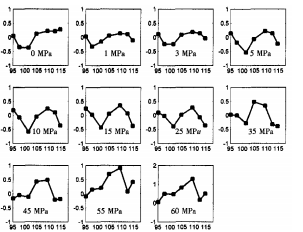
Figure 4 Measurement error of pressure sensor after temperature compensation
In the process of ambient temperature change from -5 ℃ to 50℃, the fluctuation of pressure and voltage after warming is no more than 0.3 mV. When converted into pressure, the error is no more than 1.5 dbar, which is about two orders of magnitude less than that without warming.
After one month of high intensity aging, four temperature points were selected for repeated experiments. The pressure error is calculated by using the new pressure coefficient calibrated at normal temperature (FIG. 5). The maximum pressure error is 1.2111. If the old pressure coefficient is used, the error exceeds 4 m, indicating that the compensation idea of separating the temperature coefficient and pressure coefficient is reasonable and effective.
5 Dynamic characteristics of the sensor
After temperature compensation, the static characteristics of the sensor meet the requirements of the project assessment, but the different response speeds of sputtering platinum resistance and pressure bridge to temperature changes will lead to compensation errors when the temperature changes rapidly, so it is necessary to dynamically correct. The pressure sensor is heated and cooled in the high and low temperature chamber (the pressure is one atmosphere, and the temperature coefficient is positive), and the output of temperature and pressure is shown in Figure 6. It can be visually seen that the response speed of platinum resistance is faster than that of pressure bridge, and overshoot may occur in temperature compensation (FIG. 7).
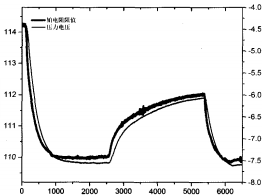
FIG. 6 Resistance value and pressure response diagram of the sensor when the temperature changes
It is found that under one atmosphere of pressure, the pressure after temperature replenishment will increase in the case of rapid cooling and decrease in the case of temperature warming. Combined with the temperature characteristics in Figure 1, it is not difficult to infer that the influence of rising and cooling on the pressure after temperature replenishment is opposite in the case of high pressure.
The first order low-pass filtering with the time constant of 100S can suppress the temperature overcompensation and improve the precision of dynamic measurement. However, this method of extending the response time of fast sensors to match the response time of slow sensors will sacrifice the resolution, and more effective dynamic correction methods need further research.
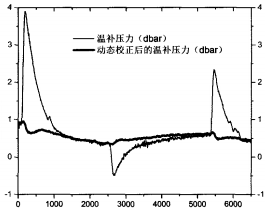
FIG. 7 Dynamic measurement diagram of temperature supplement pressure after matching time constant
6 Summary
In this paper, the temperature characteristics of piezoresistive pressure sensor are studied deeply. On this basis, a simple and practical temperature compensation method is proposed, which can realize the high precision pressure temperature compensation in the range of -5 ~ 5O ℃ and 0 ~ 60MPa with only three temperature compensation coefficients. At the same time, the correction method can realize the separation of pressure coefficient and temperature coefficient. The pressure sensor only needs to do a pressure calibration experiment under multiple temperature points in the high and low temperature test box when leaving the factory, and the temperature coefficient of the sensor can be calculated. After that, the temperature coefficient remains unchanged, and the subsequent pressure calibration can only be carried out at room temperature, which has good operability and practicability. This method has certain reference significance for temperature compensation of similar pressure sensors.
References:
[1] Ji Shenghao. Software Implementation of Temperature Drift Compensation for Diffused Silicon Pressure Sensor [D]. Xi 'an: Northwestern Polytechnical University, 2007. (in Chinese)
[2] Liu Peng. Research on the Realization of Temperature Compensation Method for Piezoresistive Pressure Sensor [D]. Tianjin: Tianjin University, 2010. (in Chinese)
[3] Farhad M Fozdar, G eoffrey J Parker. M atching Tem perature and C onductivity SensorO]. M atching tem perature and C onductivity Sensoro]. A m erican M eteorological Society, 19 85, 15 (11)15 5 7-15 6 9. A m erican m eteorological Society, 19 85, 15 (11)15 5 7-15 6 9.
[4] R oll G L ueck. T herm al Inertia of C on du ctivity C ells: T heory[JJ. Jou rnal of A tm osph eric & O cean ic T echn ology, 19 90, 7: 74 1 -- 755.
[5] Wang Yang, Li Zhanqiao, et al. Study on CTD data processing of Single temperature sensor lJl_ Marine Surveying and Mapping 2009 29:62 -- 65.